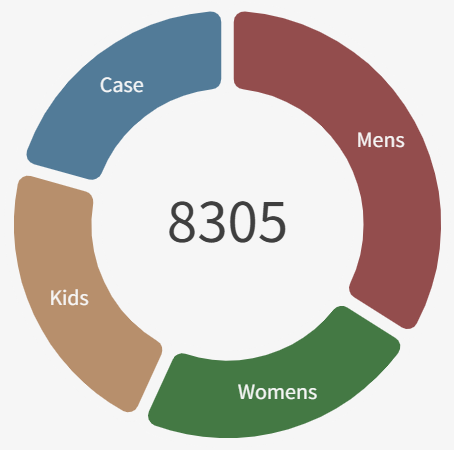
One Small Design Change That Makes Your Power BI Dashboards Look Professional
Why Most Power BI Sales Dashboards Don’t Drive Decisions (And What To Do Instead)
Many sales dashboards look impressive, but weekly meetings still end with:
“Let’s review this again next week.”
The data is there. The charts are there.
What’s missing is a clear path from signal → driver → action.
The Problem with “Reporting-Ready” Dashboards
Standard Power BI sales dashboards are usually built to show everything:
traffic, tickets, YTD, LY, plan, and all different kinds of KPIs… all on one canvas.
That’s great for reporting, but it quietly creates three problems:
No clear trigger: people see that results moved, but not whether momentum is rising or falling.
No ranked drivers: when everything is a KPI, nothing clearly owns the story.
No next action: the dashboard ends at “what happened” instead of “what we do next.”
The result? Smart people sit in meetings, scrolling and slicing, without ever agreeing
what actually drove the change or what they will test next week.
What a Decision-Ready Sales Dashboard Looks Like
A decision-ready dashboard doesn’t try to show every metric.
It keeps attention on three questions:
Are we gaining or losing momentum?
Which drivers matter most this week?
What action will we take before the next review?
The two dashboards in this pack are designed around that flow:
Trigger → Cause → Action.
They use Deneb to control ordering, layout and narrative, so the visuals
quietly guide the conversation instead of fighting for attention.
See the Decision-Ready Flow in Action
This short video shows how attention moves
from signal → driver → action
inside a real Power BI dashboard.
Many people realize what’s missing
only after seeing the structure once.
Why I Built a Premium Power BI Deneb Template Pack
In the book Decision-Ready Dashboards and the NSM / KPI workshops, I talk a lot
about driver-based design, variance share, and weekly decision structure.
The natural next question is:
“Okay, but what does that actually look like in a real Power BI report?”
This Premium Power BI Dashboard Template pack is my answer:
two complete sales dashboards built with Deneb and DAX, so you can
see the architecture, copy it, and adapt it to your own data.
What’s Included in the Premium Template
When you download the pack, you get access to two full dashboards plus the
underlying logic.
1. Sales Momentum Dashboard
Sales Momentum Index vs 12-week rolling average
Contribution mix: Tickets vs Sales vs other drivers
Rolling 12-week context chart with event bands
Trigger text that explains what changed this week
2. Driver-Based Weekly Review Dashboard
Ranked drivers (Tickets, Conversion, UPT, etc.) by impact
Clear labels for “holding back” vs “supporting recovery”
Trigger, Cause, and Action blocks for the weekly conversation
Clean Deneb line chart focused on the main signal
Files You Receive
PBIX files for both dashboards – ready to open and explore.
Curated DAX measure list – only the measures that actually drive decisions, documented in a separate file.
Fully working Deneb specs – ready to paste into your own models and adapt.
These are not generic visuals.
They’re complete, opinionated examples of what a
decision-ready sales dashboard looks like in Power BI.
How You Can Use These Dashboards
You can use this pack in several ways:
As a reference implementation – study the layout, measures and Deneb code to design your own dashboards.
As a starting point – replace the sample model with your own sales data and keep the information architecture.
As a coaching tool – walk your team through Trigger → Cause → Action using real examples instead of slides.
However you use them, the goal is the same:
move your dashboards from “interesting reporting” to
clear decisions and next actions.
Ready to See Decision-Ready Dashboards in Action?
If you want to build sales dashboards that don’t just show KPIs, but
actually guide the weekly conversation, this Premium Power BI template pack
is the fastest way to see how it works in practice.