
🚫 Why You Still Can’t Add Images to Power BI Bar Charts—And What You Can Do About It
While Power BI has made tremendous progress in visual analytics, adding images directly into bar charts is still not officially supported in native visuals. That means if you’re trying to show country flags, item images, or any other images you want to show inside a bar chart, you’re out of luck… unless you’re using a smarter workaround.
💡 What You Can Do: Custom Image Bar Charts Using Deneb (No Code Required)
Here’s the good news:
With the Deneb custom visual (available as a Power BI add-in), you can build bar charts with images using the power of Vega and Vega-Lite.
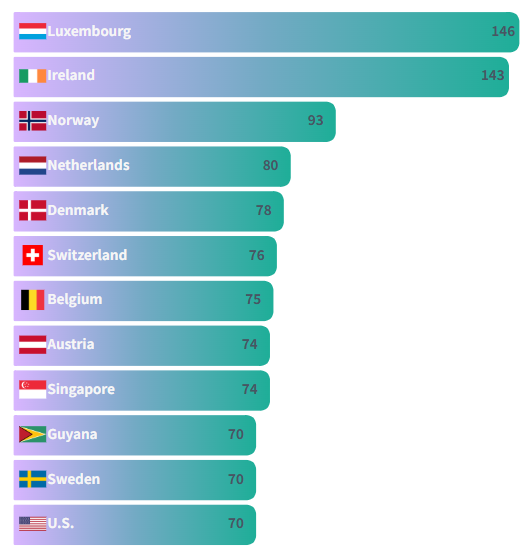
The chart shown here (👇) was created without writing a single line of code by hand.

(Example: GDP per capita by country, visualized with gradient bars and country flags)
🎨 Try This Chart in Visual Editor
✨ What Makes This Chart Special?
-
✅ No coding required
All configuration is done through an intuitive web UI with dropdowns and sliders. -
🎨 Fully customizable styles
Adjust gradient colors, image size, corner radius, label fonts, spacing, and more. -
🖼️ Images inside bars
Show country flags, icons, or company logos seamlessly—Power BI doesn’t offer this natively. -
🔄 Export to Power BI
Download the chart spec and paste it into Deneb in Power BI to instantly reproduce it with your data.
🔧 How It Works
-
Visit the visual editor (e.g., a hosted customization tool).
-
Choose your colors, gradient, and image size.
-
Download the generated JSON file.
-
Paste it into Deneb on Power BI Desktop.
-
Bind it to your dataset (Country, Value, Base64 Image column).
⚠️ Image Usage Notice for Power BI Users
To display images correctly in Power BI (e.g., within Vega or Deneb visuals), all images must be in Base64 format.
✅ How to convert your images to Base64:
You can use this free tool:
🔗 https://www.base64-image.de/
-
Upload your image (preferably a small PNG or SVG).
-
Copy the Base64 string (it will start with
data:image/png;base64,...ordata:image/svg+xml;utf8,...). -
Paste it into your dataset column or directly into your chart spec.
Recommended best practices:
-
Use lightweight or simplified SVGs.
-
Keep Base64 image data under 50KB for better performance.
📎 Want to Try It?
Check out the downloadable template and usage guide linked here.
Or explore more Deneb examples for fully custom visuals in Power BI.