May 23, 2025 | Pie Chart, Uncategorized
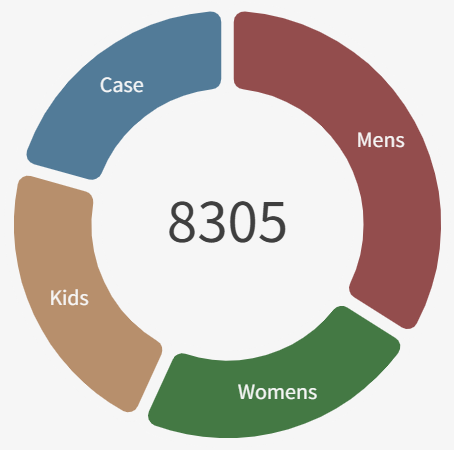
Same visuals, but one looks way nicer… With just a slight visual tweak—like adding separators to a donut chart—your entire dashboard can shift from “functional” to “polished.” It’s not about data accuracy; it’s about...
May 18, 2025 | Custom Visuals, Gradient
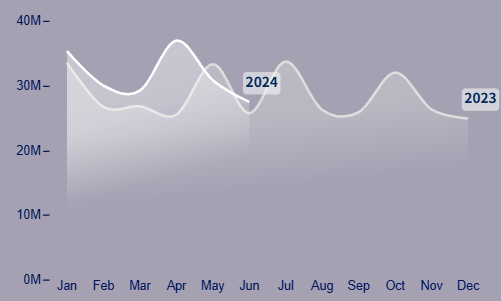
Gradient Line Chart for Power BI – No Code, Just Design If you’ve ever tried to create your dream visual in Power BI, you probably know the feeling: you research endlessly, test plug-ins, explore YouTube tutorials… and yet, the result never quite matches the...
May 18, 2025 | Custom Visuals, Gradient
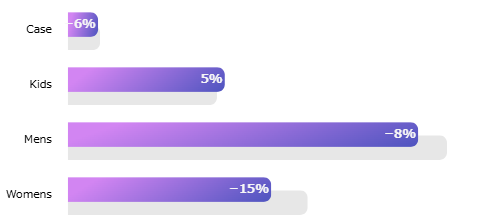
Why Gradient Charts Matter in Dashboards In modern dashboard design, how data looks is almost as important as what it shows. Gradient charts help strike that balance – they’re elegant, informative, and subtly powerful. But their benefits go beyond just looks. The...
Apr 10, 2025 | Uncategorized
Starter Guide How to Custom Custom Guide Code Copy { "$schema": "https://vega.github.io/schema/vega-lite/v5.json", ...} Show...
Mar 25, 2025 | Free Template
