
Data Visualization
Why Data Visualization Alone Doesn’t Improve Decision Making
This is one of the most important limits of modern data visualization.
A chart can be clean, accurate, elegant, and easy to read —
and still fail to move a team forward.
In many cases, people assume that once the data is clear,
the next step — what to do — should be figured out by the team.
But that assumption is exactly where many decisions break down.
Because in reality, decision making is not just about seeing the data.
It is about aligning attention, understanding what matters most,
and narrowing the space of possible actions.
That is where dashboards can play a much larger role.
This is one of the most important limits of modern data visualization. A chart can be clean, accurate, elegant, and easy to read — and still fail to help a team decide what to do next.
That is because decision making requires more than visibility. It requires direction.
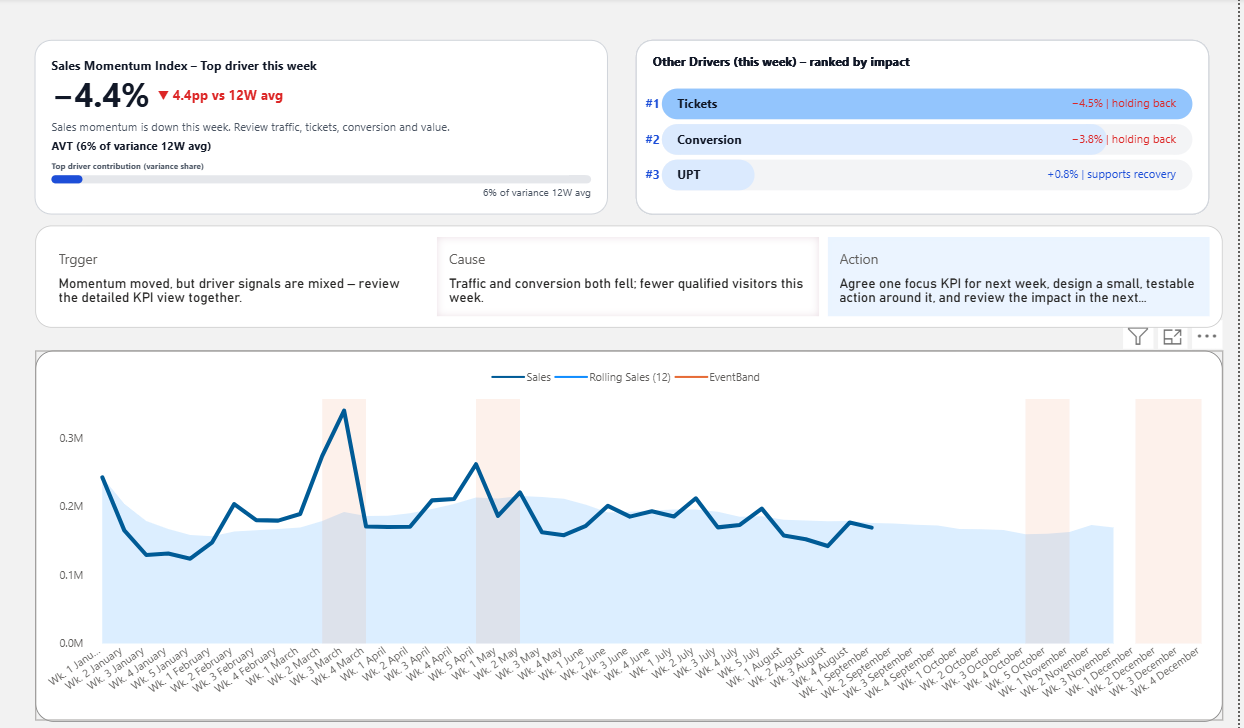
A decision-oriented dashboard helps a team move from performance shift to cause and next action.
Dashboards are not just visualization tools
Dashboards are often described as data visualization tools. And at a basic level, that is true.
But if we step back, their role can be much broader.
A dashboard is not just a place to display data. It is an interface between data and business decisions.
When designed well, it does not simply show performance. It helps people focus, interpret change, and move toward a clearer decision.
In that sense, dashboards are not only about clarity. They are part of how organizations improve how they think and act.
What data visualization does well
Data visualization is excellent at helping people compare, detect patterns, monitor changes, and communicate information. Those are real strengths.
But in business reviews, leadership meetings, and weekly performance discussions, people often need one layer more: they need help deciding where to focus and what to discuss next.
Why teams still struggle after seeing the data
Many dashboards answer the question: What happened?
But fewer dashboards answer:
- What matters most right now?
- What is likely driving the shift?
- What should the team decide next?
Without that structure, teams often fall into long discussions, extra analysis requests, and weak alignment.
The missing layer between insight and action
The missing layer is not more charts. It is decision structure.
That includes thresholds, driver prioritization, action framing, and a clear signal of what deserves attention now.
This is the difference between standard data visualization and data visualization for decision making.
Go one step further
If you want dashboards to do more than display information, explore Decision Dashboard and see how this idea grows into Decision OS.