
Track TikTok Performance in One Structured Dashboard
TikTok’s native analytics is useful — but fragmented across tabs. This template brings your key TikTok KPIs into one structured view so you can spot what’s working, understand what’s changing, and decide what to repeat next.
In one line: See all your TikTok KPIs in one screen — with time toggles, KPI switching, audience activity patterns, and top content rankings — so your analytics turns into a repeatable posting strategy.
TikTok analytics is good — but not built for quick decisions
Most creators don’t struggle because they lack data. They struggle because the data is scattered.
- You jump between tabs to compare Views, Likes, Followers, and Engagement.
- You can’t easily connect performance shifts to audience activity patterns.
- It’s hard to see whether growth is daily, weekly, or sustained over time.
- You end up “checking metrics,” not building a repeatable content plan.
This dashboard is designed for one goal: turn analytics into a clear next action.
Everything that matters — organized for fast scanning
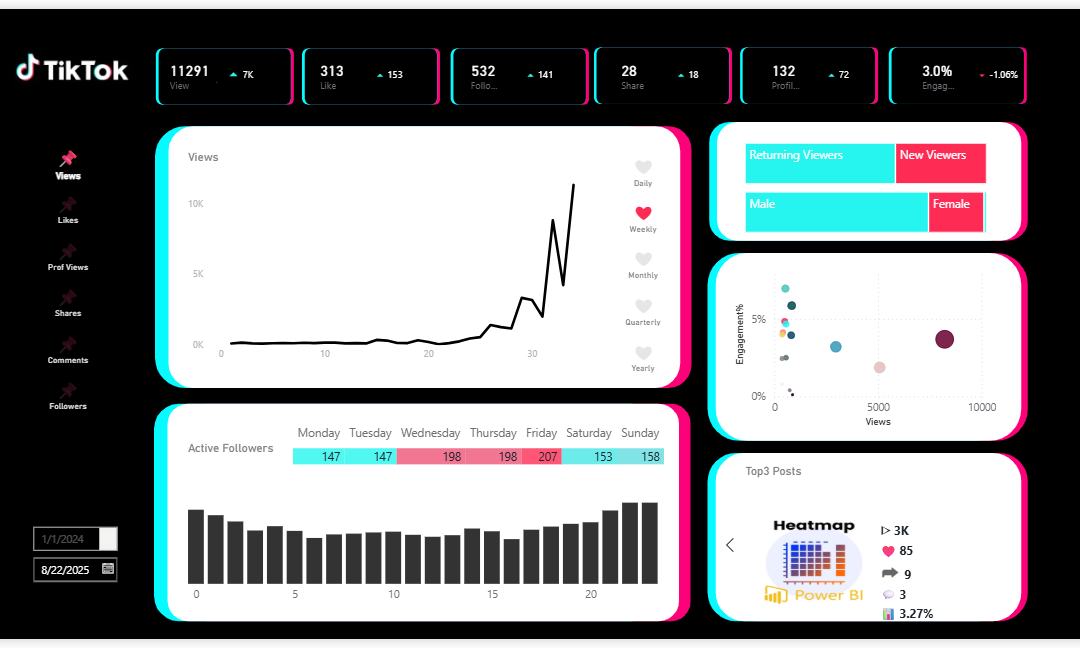
This template consolidates your core TikTok performance and audience signals into a single view:
- Views / Likes / Comments / Shares — side by side, not across tabs
- Follower growth — trend visibility without digging
- Daily / Weekly / Monthly toggle — spot short-term vs sustained momentum
- KPI switching — compare Viewer vs Follower focus without rebuilding visuals
- Active followers by day & hour — post timing becomes obvious
- Top content ranking — identify winners fast (with thumbnail-style recognition)
The point isn’t more charts. It’s one structured view that answers: “What should I repeat next?”
This isn’t a dashboard of metrics — it’s a dashboard of patterns
TikTok shows you numbers. This dashboard helps you see patterns:
Cross-metric clarity
Instead of checking each KPI in isolation, you can compare performance signals together and understand what’s moving the outcome.
Time perspective you can switch instantly
Toggle Daily / Weekly / Monthly to tell the difference between a spike and a trend — without rebuilding views.
Audience activity that connects to planning
Active follower patterns by weekday and time-of-day help you plan posting with evidence, not intuition.
Top posts become instantly recognizable
Ranking + visual recognition makes it easy to identify what’s actually driving results and what to double down on.
You get the dashboard + the structure behind it
- Power BI dashboard template — ready to connect to your TikTok data
- Structured model — designed for smooth importing and analysis
- Toggle-ready layout — built for time/KPI switching workflows
- Adjustable design assets — clean UI elements you can customize
If TikTok analytics is “data,” this template is “a decision view.”
Best for creators who want clarity — not more tabs
- Creators building a repeatable posting strategy
- Social media managers tracking multiple posts and trends over time
- Marketers who need one reporting view for content + engagement + audience
- Anyone who wants to answer “what should I repeat next?” quickly