
Description
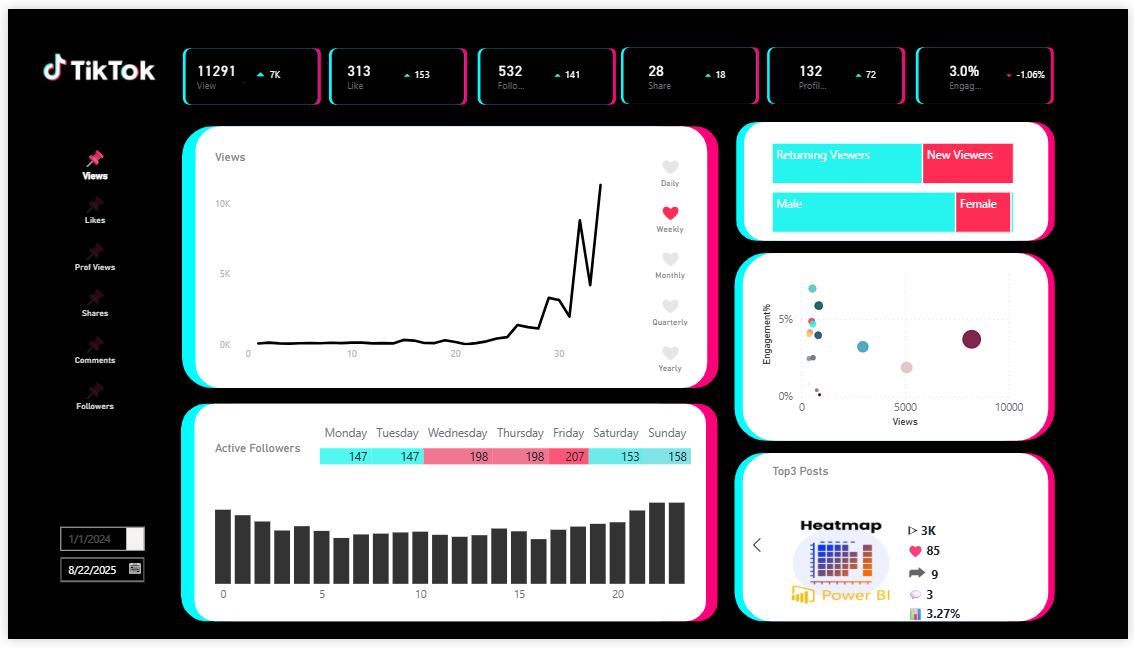
Track TikTok Performance in One Screen
TikTok’s built-in analytics is useful, but it’s scattered across tabs.
This Power BI template consolidates your key metrics and content performance so you can
spot what’s working and decide what to repeat next.
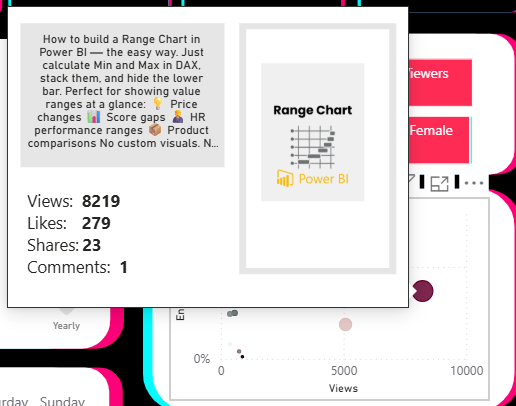
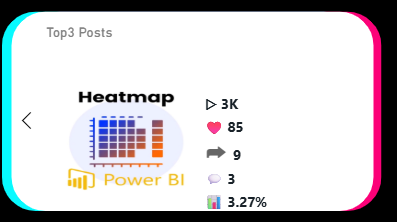
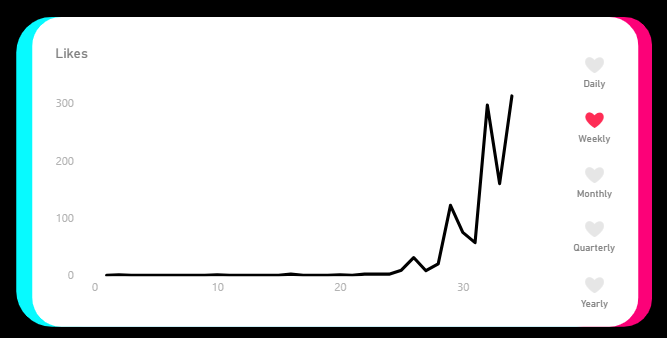
- Top Posts with thumbnail preview
- Daily / Weekly / Monthly toggle
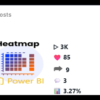
- Active followers by day × hour
What Makes It Different
- Top content is instantly recognizable. Pull post thumbnails (from your TikTok thumbnail URL) so you know exactly which posts are driving results.
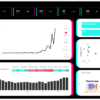
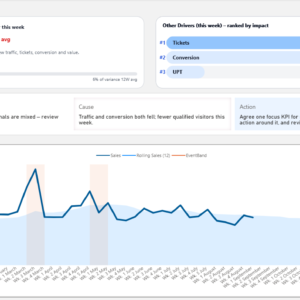
- Everything in one dashboard view. Views, Likes, Posts, Followers, and engagement trends—no jumping between screens.
- Time trends you can switch fast. Compare performance by day, week, or month to understand sustained momentum.
- Follower activity patterns. See how active followers change by weekday and time-of-day to plan posting timing.
Best for creators who want clarity, not more charts
If you’re tracking growth and engagement but you can’t quickly tell what content to double down on,
this template helps you turn analytics into a repeatable posting strategy.
What’s Included
- Power BI dashboard template — ready to connect to your TikTok data
- Database template — structured for smooth importing and analysis
- Adjustable PowerPoint background — customize to match your brand
- SVG background assets — scalable design elements for clean UI
Who It’s For
- TikTok creators who want a clear view of performance beyond default app metrics
- Social media managers tracking multiple posts and patterns over time
- Marketers who want a single reporting view for content + engagement + audience
See your top posts at a glance, understand trends over time, and choose the next action with confidence.
Reviews
There are no reviews yet.