Gradient Line Chart for Power BI – No Code, Just Design
If you’ve ever tried to create your dream visual in Power BI, you probably know the feeling: you research endlessly, test plug-ins, explore YouTube tutorials… and yet, the result never quite matches the vision in your head.
For me, that moment came when I wanted a clean, minimal gradient line chart with a transparent background – something that felt modern and could blend seamlessly with my Power BI dashboard.
While Power BI allows some shading and area options, creating a true gradient effect – especially one with transparency – is almost impossible without custom code or external tools. I tried everything, from adjusting shade intensity to using bookmarks and third-party visuals.
That’s why I created this chart – not just for me, but for all Power BI users who gave up halfway. This visual is designed to give you a beautiful, editable chart without code. No DAX. No external add-ins.
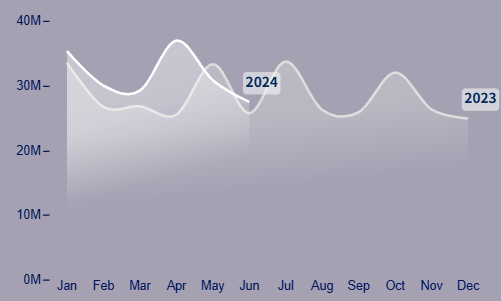
📌 What Does This Chart Do?
📊 Displays 2-year sales trends (e.g., 2023 vs 2024)
📅 X-axis is fixed to months (Jan to Dec)
🧊 Transparent background – when used in Power BI with background: none, it fully blends with your dashboard
It’s based on the data format like linked below:
View sample data
Most dashboards suffer from visual noise. This chart strips things down – but not at the cost of clarity. The gradient subtly highlights differences over time while remaining elegant and aligned with modern UX.
You shouldn’t have to learn Vega code just to make something beautiful. This template does it for you.
Give it a try, and make your dashboard a place people actually want to look at.