
Why Gradient Charts Matter in Dashboards
In modern dashboard design, how data looks is almost as important as what it shows. Gradient charts help strike that balance – they’re elegant, informative, and subtly powerful. But their benefits go beyond just looks.
The Purpose of Gradient Charts
Gradients are not just aesthetic. They enhance readability, guide user attention, and give visual weight to what’s important.
Key Benefits of Gradient Charts
- Visual Depth: Gradients add dimension, making charts appear layered or elevated, which helps distinguish elements.
- Attention Guidance: Color transitions help highlight peaks, dips, or transitions in time-series data.
- Perceived Movement: The smooth shift in color can imply progression, ideal for showing growth or cycles.
- Design Harmony: Gradients can align better with brand colors and modern UI styles.
Where Are Gradient Charts Most Useful?
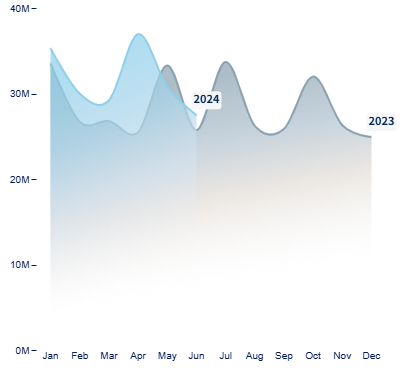
- Marketing Dashboards: Show campaign engagement trends using layered gradient area charts.
- Financial Reports: Emphasize revenue fluctuations or forecasted growth zones.
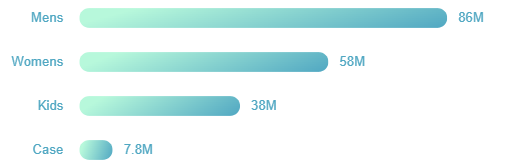
- Product Analytics: Highlight adoption curves or retention drop-offs with smooth color fades.
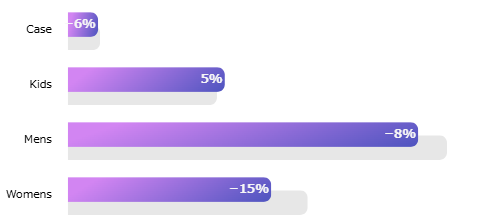
- KPI Monitoring: Use gradients to track deviation levels in targets, thresholds, or quality checks.
🧠 Psychological Effects of Gradients
According to visual perception studies, gradients simulate natural lighting and shadow, making them easier for the brain to process than flat colors. They reduce cognitive load and improve data retention.
📌 Summary
Gradient charts are more than eye-candy. When used thoughtfully, they enhance the message your data tells, making dashboards not only beautiful but also meaningful.
Want to use gradient charts without code? Check out our visual gallery of Power BI templates.